How To View Call Metrics On The Yeastar P-Series Cloud PBX Wallboard
This guide is for Yeastar P-Series PBX users who need to access and analyse queue call statistics on the Wallboard.
Step 1: Access The Wallboard From The Linkus Web Client
- Open your web browser and enter the IP address of the Linkus Web Client.
- Log in using your username (extension number or email address) and password (your extension user password).
- Once logged in, navigate to Call Centre Console > Wallboard.
Step 2: Filter Queue Call Statistics
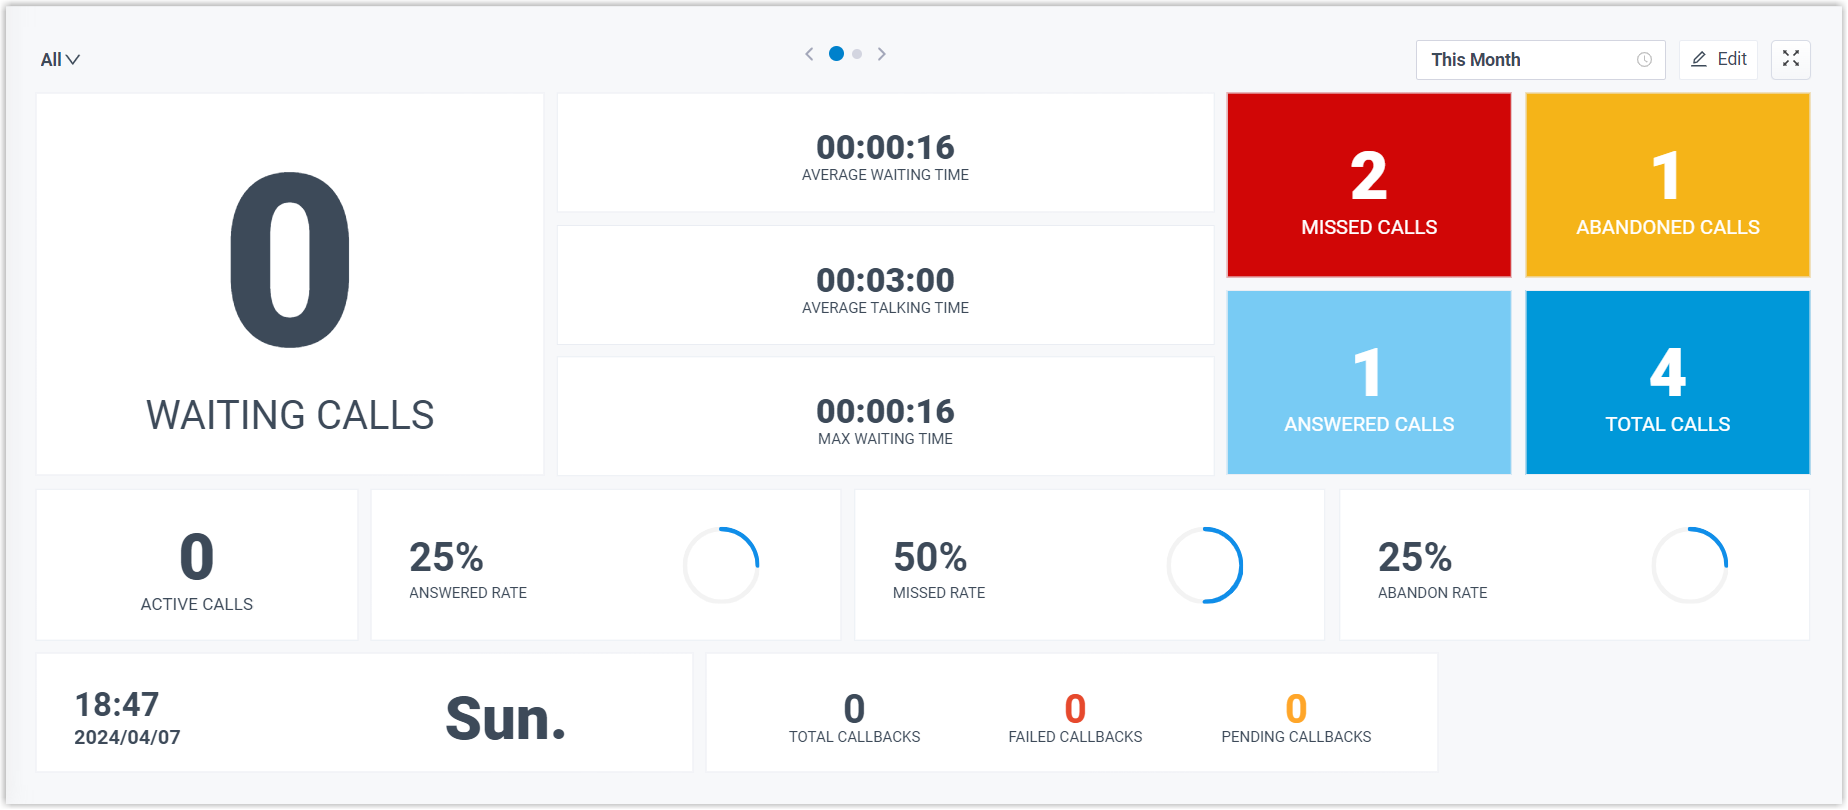
- To view call statistics, you can choose to see data for all queues or filter by a specific queue.
- To view statistics for all queues, select All from the top-left corner of the Wallboard.
In the top-right corner of the Wallboard, choose a time range.

- Today: View today's call statistics.
- This Week: View call statistics for the current week.
- This Month: View call statistics for the current month.
The call statistics for all queues within the chosen time range are now displayed.

Tip:
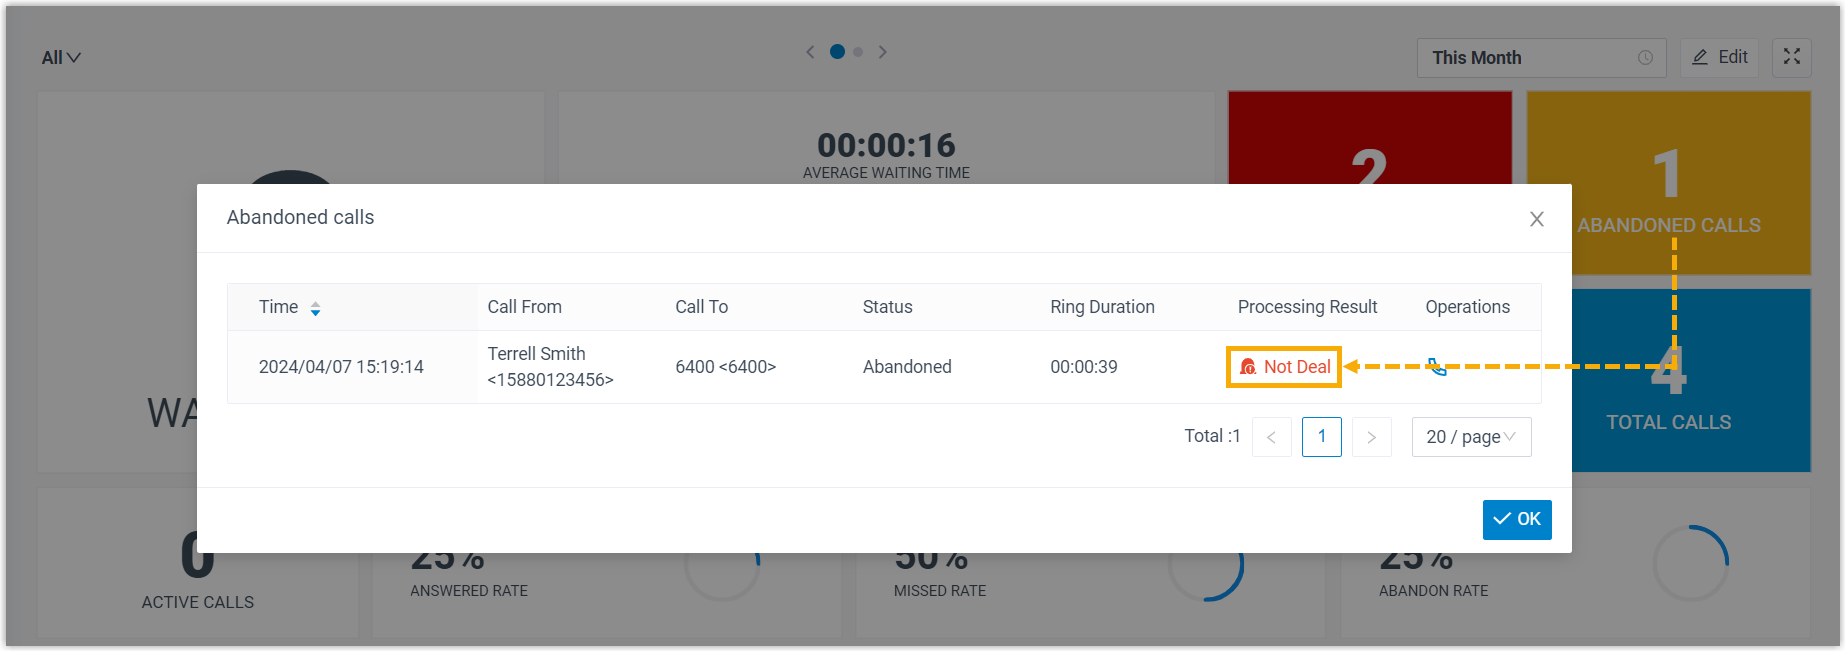
To view and manage Missed Calls and Abandoned Calls, click on the relevant widgets to access the queue call logs. You can update the processing status, and any authorised agents will see your updates on their Linkus clients.

(Optional)
At the top of the Wallboard, click the toggle button to switch to a tabular view. This view offers detailed information about call metrics for each queue.
(Optional)
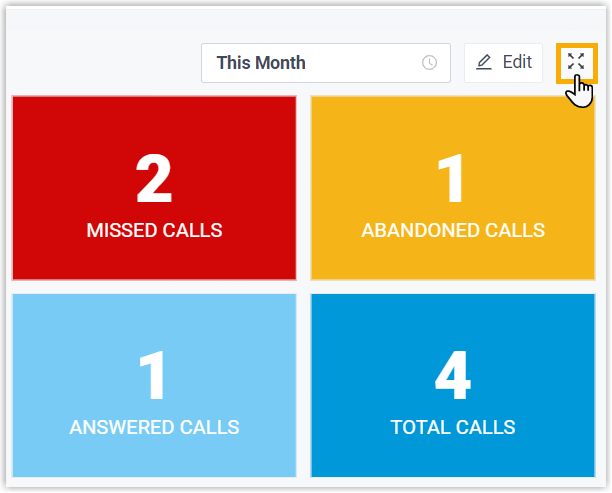
To display the Wallboard in a separate browser window, click the icon in the top-right corner of the Wallboard.

To display the Wallboard in a separate browser window, click the icon in the top-right corner of the Wallboard.
(Optional)
Set the Wallboard to automatically alternate between summary and tabular views with a scrolling display. To do this, click on Settings in the top-right corner of the Wallboard, configure the toggle time, and save your changes.
Set the Wallboard to automatically alternate between summary and tabular views with a scrolling display. To do this, click on Settings in the top-right corner of the Wallboard, configure the toggle time, and save your changes.
- At the top of the Wallboard, click Play.
The Wallboard automatically switches between summary view and tabular view, displaying a scrolling feed at the specified time interval.
View Call Statistics for a Single Queue
In the top-left corner of the Wallboard, select your preferred queue from the drop-down menu.

In the top-right corner of the Wallboard, select a time range:
- Today: View today's call statistics.
- This Week: View call statistics for the current week.
- This Month: View call statistics for the current month.
The call statistics for all queues within the selected time range will now be displayed.
(Optional)
(Optional)
Click the icon to open each queue's Wallboard in a separate browser window. For example, you can display the Service department's Wallboard.
Wallboard for Service agents in one window, while showing the Sales department's Wallboard for Sales agents in another.
Related Articles
Yeastar P-Series Cloud Edition PBX Wallboard: An Overview
This article outlines the features of the Yeastar P-Series Cloud Edition PBX Wallboard and the call metrics it displays. The Wallboard offers a clear and straightforward way to view real-time information related to queues. Capabilities of the Yeastar ...How To Access And View Call Reports On Yeastar P-Series Cloud PBX
This article is for Yeastar P-Series PBX users who need to access and view reports, and it explains the different categories of call reports. The Yeastar P-Series PBX call activity report provides granular insights into the hourly, daily, and monthly ...How To Create Call Reports On Yeastar P-Series Cloud PBX
This guide helps Yeastar P-Series PBX users create visual call reports to analyse call data easily. Log In: Access the PBX web portal and go to Reports and Recordings > Call Reports. Choose Report Type: From the Report Type dropdown menu, select the ...How To Search For And Download Call Recording Files On Yeastar P-Series Cloud PBX
This guide helps Yeastar P-Series Cloud PBX users search for and download call recordings. Search Call Recordings Log In Access the PBX web portal and go to Reports and Recordings > Recording Files. Set Search Criteria You can search recordings by ...How To Schedule Call Reports On Yeastar P-Series Cloud PBX
This guide is for Yeastar P-Series Cloud PBX users who want to schedule call reports to be automatically emailed to recipients at a set time. A scheduled call report provides a visual summary of call statistics for selected objects over a chosen time ...